doi: 10.62486/latia2024103
ORIGINAL
Color in images: a machine vision
approach to the measurement of CIEL*a*b* coordinates in bovine loins
El color en imágenes: un enfoque de
visión artificial para la medición de coordenadas CIEL*a*b* en lomos de bovino
Olga Lucía Torres Vargas1 *, Mateo Valencia Buitrago1 *
1Universidad del
Quindío. Colombia.
Cite as: Torres Vargas
OL, Valencia Buitrago M. Color in images: a machine vision approach to the
measurement of CIEL*a*b* coordinates in bovine loins. LatIA. 2024; 2:103. https://doi.org/10.62486/latia2024103
Submitted:
03-02-2024 Revised: 09-05-2024
Accepted: 15-08-2024 Published: 16-08-2024
Editor: Prof.
Dr. Javier González Argote 
ABSTRACT
Electronic machine vision systems bring together a
set of technologies and techniques used to capture, process and analyze images
to perform a specific task, such as object or measurement pattern recognition.
These systems rely on image processing and machine learning algorithms to
interpret visual information. Therefore, the objective of this research was the
construction of an electronic machine vision system (SVA) for color analysis in
bovine (longisimus dorsi) loins based on the CIEL*a*b* color space. The VAS
implementation was carried out using the programming language Python 3.9
programming language and the color parameters obtained were compared with those
obtained on a Minolta CR-400 colorimeter (CM). Both systems were synchronized
to provide the user with information about the color coordinates in the samples
of loins stored for 6 days at 4°C. The results obtained showed no significant
differences. The results obtained showed no significant differences in the
values of the L* parameter, while b* and a* showed significant differences
during the storage time of the loins. These results are attributed to the
oxidation process of the myoglobin and to factors such as breed, feeding and
slaughtering process of the cattle, which affect the color of the samples. The
results obtained indicate that VAS could be used for the determination of color
during the storage of beef loins in real time, offering a non-invasive and
low-cost solution to the actors in the meat chain.
Keywords:
Image Analysis; Beef; Colorimeter; Artificial Vision System.
RESUMEN
Los
sistemas electrónicos de visión artificial reúnen un conjunto de tecnologías y
técnicas utilizadas para capturar, procesar y analizar imágenes que realizaran
una tarea específica, como el reconocimiento de objetos o patrones de medida.
Estos sistemas se basan en algoritmos de procesamiento de imágenes y aprendizaje
automático para interpretar la información visual. Por lo tanto, el objetivo de
esta investigación fue la construcción de un sistema electrónico de visión
artificial (SVA) para el análisis de color, en lomos de bovino (longisimus
dorsi) fundamentado en el espacio de color CIEL*a*b*. La implementación del
SVA se llevó a cabo utilizando el lenguaje de programación Python 3.9 y los
parámetros de color obtenidos fueron comparados con los obtenidos en un
colorímetro Minolta CR-400 (CM). Ambos sistemas fueron sincronizados para
proporcionar al usuario información acerca de las coordenadas de color en las
muestras de los lomos almacenados durante 6 días a 4°C. Los resultados
obtenidos, no presentaron diferencias significativas en los valores del parámetro
L*, mientras que b* y a* presentaron diferencias significativas durante el
tiempo de almacenamiento de los lomos, estos resultados son atribuidos al
proceso de oxidación de la mioglobina y a factores como la raza, la
alimentación y el proceso de sacrificio de los bovinos, que afectan, el color
de las muestras. Los resultados obtenidos indican que el SVA podría ser
utilizado para la determinación del color durante el almacenamiento de lomos de
bovino en tiempo real, ofreciendo una solución no invasiva y de bajo costo a
los actores de la cadena cárnica.
Palabras
clave: Análisis de Imagen; Carne de Bovino;
Colorímetro; Sistema de Visión Artificial.
INTRODUCTION
Color
is one of the organoleptic characteristics that most influences the
acceptability of meat and plays an important role in the consumer's purchasing
decision (Parra et al., 2021). One of the problems presented by the evaluation
of color is the methodology used to obtain significant information, which makes
it possible to compare and improve meat products in a versatile, rapid, and
on-site manner. Color measurements in foods are usually carried out with
digital colorimeters, which, although easy to use and calibrate, have
limitations such as cost, specialized maintenance, the size of the measurement
area, and the need for contact with the surface to be measured (Sanmartín et
al., 2021). Therefore, it is important that color assessment is performed consistently
and objectively to obtain reliable and reproducible results that reflect human
perception and can be performed in a non-invasive manner (Wu & Sun, 2013).
The
CIEL*a*b* color space has proven to be one of the most suitable for color
assessment in the food area; it correlates numerical color values consistently
with human visual perception (Anilkumar et al., 2021). This Cartesian system
consists of three axes: L* vertical, informs us of the degree of lightness or
brightness of a color (Wyszecki & Stiles, 2000) and can take values between
0 (black) to 100 (white); a* horizontal, indicates the content of red (+a*) or
green (-a*); and b* horizontal and perpendicular to a*, which represents the
content of yellow (+b*) or blue (-b*).
Studies
using VAS for color assessment have focused on converting images obtained using
the RGB color measurement system to the CIEL*a*b* system (Larraín et al.,
2008). Analysis of pork loin quality using an online VAS and an artificial
intelligence model indicated that VAS could provide an effective tool for
predicting color and marbling in pork on processing lines in real time (Sun et
al.,2018). SVA and embedded systems were used as alternatives to evaluate the
freshness of beef, using principal component analysis (PCA) and support vector
machines (SVM); the results show that the proposed system can successfully
predict freshness, suggesting its feasibility for on-site and real-time use
(Arsalane et al., 2020). VAS can accurately determine the color of meat
products in CIEL*a*b* space, ensuring the quality of their products through
fast and accurate assessment, characteristics that, in turn, can influence
consumer perception and business profitability (Nasiri & Mohi, 2021).
Altmann et al. (2022) analyzed the methodology of human perception of color
differences in raw pork using a computer vision system. Modzelewska-Kapituła
& Jun (2022) performed VAS applications in volume and surface area
measurement, quality assessment, meat chemical composition determination, and
sensory quality prediction. Developing a VAS that can accurately determine
color in the CIEL*a*b* space of images in bovine loins is an invaluable tool
for the meat industry (Nasiri & Mohi, 2021). Therefore, the development of
VAS for color analysis in meat products has become relevant due to its
importance as an indicator of meat quality (Nasiri & Mohi, 2021).
METHOD
The
project presented below was carried out in two stages. The first stage involved
the construction of an artificial vision electronic system (SVA) for the color
analysis of Longissimus dorsi bovine loins and their physical components. The
loins were acquired from a supermarket in Armenia, Quindío, with Invima
certification for their commercialization. The hardware measurement system was
programmed in the Python 3.9 system in the second stage. Both systems, duly
synchronized, present the CIEL*a*b* coordinates to the user in fresh beef
samples (slaughtered on day zero) and stored for six days at four °C, as
explained below.
Configuration
of the Raspberry Pi 4 for image capture and processing in CIEL*a*b* color space
To
ensure efficient capture and processing of high-quality images and the speed
needed for the application, the selection of the VAS hardware is crucial. It
depends on the level of accuracy and the environment of use. Essential
components include high-resolution cameras, image processors, graphics
processing units (GPUs), and data storage devices, which must be carefully
chosen to ensure the system meets the required functions. The components
presented in table 1 were used to construct the obtained VAS.
|
Table 1. Hardware components used in the construction of the machine
vision system (SVA)
|
|
|
Description
|
Characteristics
|
|
Raspberry pi 4
|
The Raspberry Pi 4 is
a single board computer (SBC) developed by the Raspberry Pi Foundation. It is
a newer, more powerful version of the Raspberry Pi series of computers, known
for its compact size, low cost, and
versatility.
|
·
Processor: Broadcom
BCM2711 quad-core processor
·
RAM memory: 4 GB
·
GPIO: Retains the GPIO
(General Purpose Input/Output) interface that allows connection of external
electronic components and peripherals.
·
Connectivity: Offers a
variety of connectivity options, including USB 3.0 and 2.0 ports, Gigabit
Ethernet connection, dual-band 802.11ac Wi-Fi and Bluetooth 5.0
|
|
Camera
|
The Logitech PRO C920
is a high-quality webcam that offers an excellent combination of video
resolution, image quality, clear audio and ease of use.
|
·
Video resolution: The C920
captures Full HD 1080p video at 30 frames per second.
·
Automatic lighting
correction: Incorporates automatic lighting correction technology that
automatically adjusts exposure and white balance.
|
|
Lighting
|
White LED strip,
lighting device consisting of a series of white LEDs arranged in an elongated
and thin structure.
|
·
The power consumed by the
entire strip is 14.9W, which generates a luminous efficacy of 148l m/W.
|
To ensure the proper functioning of the VAS, a black
film was placed on the outer surface of the equipment, which prevents the
passage of light into the measuring compartment of the sample image (figure 1),
which is covered by a white film on the inside. Both films eliminate the
interference of external light and stabilize the reflection of the light inside
the measuring compartment.
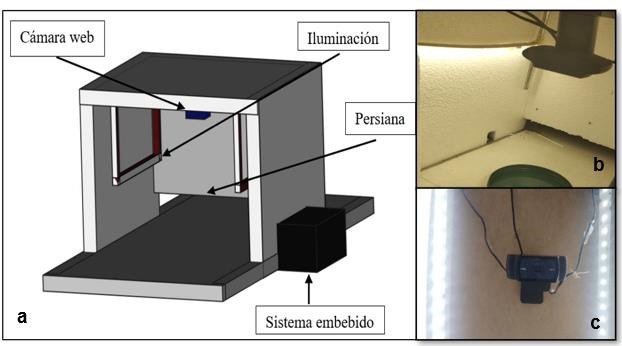
Figure
1. a) Machine Vision System (SVA) for color
measurement and analysis of bovine loin samples, b) Internal compartment of the
SVA, c) Positioning of the camera and the illumination system
Image
acquisition process in the Machine Vision System (SVA)
For the implementation of a VAS according to the
requirements proposed and taking into account the characteristics of the
hardware acquired, we proposed the design of software that allows the
calibration of the camera and the detection of the color of the bovine loins,
following the stages proposed in the block diagram shown in figure 2. An
embedded system conforms to the central axis of this stage; such a system was
implemented in a Raspberry Pi 4, running the Raspberry Pi OS, which is in
charge of capturing the image, segmenting it, resizing it, storing it, and
delivering a response in terms of the CIEL*a*b* system to the user.
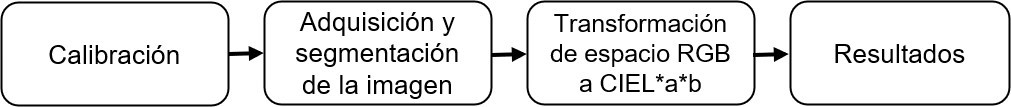
Figure
2. Stages established in the design and
construction of the software for the Machine Vision System (SVA)
Once the synchronization of the equipment was
completed, the calibration stage was performed. The focal length and optical
center obtained in the camera calibration matrix are presented in table 2.
These values were used in the calibration function to obtain a better image
resolution at the moment of capturing the focal length (fx, fy), optical
centers (cx, cy), and the comparison of the image obtained in the uncalibrated
camera, as shown in figure 3.
|
Table 2. Logitech
PRO C920 camera intrinsic parameter values
|
|
Parameters
|
Value
|
|
fx
|
956.602
|
|
fy
|
103.179
|
|
cx
|
291.159
|
|
cy
|
73.680
|
A Logitech PRO C920 camera was used to determine the
color, which offers advantages such as capturing a large amount of spatial
information, the ability to measure surfaces of various sizes, availability of
a wide range of models at more affordable prices and does not require direct
contact with the surface to be measured. However, using theoretical models, the
information obtained in color space Red, Green, and Blue (RGB) must be
transformed to CIEL*a*b* color space (Castellanos et al., 2022). The parameters
and equations used at this stage are presented in table 3.
|
Table 3. Characterization of color in bovine loins: equations and
specialized equipment
|
|
Parameters
|
Equations
|
Color measurement equipment
|
|
Brightness: L*
|
L*
= 116 (𝑌1/3/𝑌𝑛)− 16 Ec. (1)
|
|
|
Coordinate
|
a* = 500 [(𝑋1/3/ 𝑋𝑛) − (𝑌1/3/𝑌𝑛)] 𝐸𝑐. (2)
|
|
coordinate: a*
|
|
|
b* = 200
[(𝑌1/3/Yn)− (𝑍 1/3Zn] 𝐸𝑐. (3)
|
Colorimeter
CR-400
|
|
Coordinate
|
(Konica Minolta Sensing Americas. ,2023)
|
|
coordinate: b*
|
|
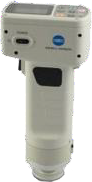
In order to establish a comparison parameter, color
measurements were made in the VAS and the Konica Minolta CR-400 colorimeter (table
3), taking the color coordinates L*, a*, and b* in five points of each sample
of fresh beef loins and stored for six days, the reported values were
calculated as the average of these measurements. The determination and
expression of color were carried out based on the CIEL*a*b* coordinates (table
3) and reflectance values (CIE, 1976), obtaining the coordinates: Luminosity
(L*), red-green (a*), yellow-blue (b*), directly from the equipment.
RESULTS AND DISCUSSION
The results obtained during the realization of the
project are presented below; once the construction of the electronic system and
the programming of the VAS hardware measurement system in its structural form
were completed, a compartment was built for the acquisition of the images,
which functions as the main structure of the equipment it supports the sample
of bovine loins to be analyzed and the other components, as shown in figure 1.
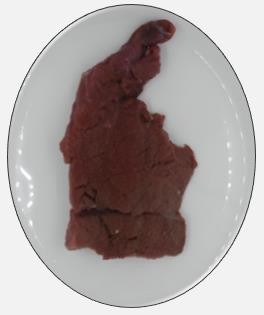
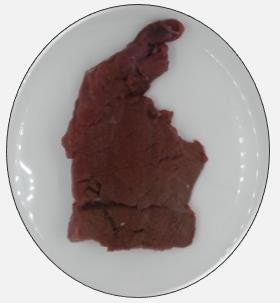
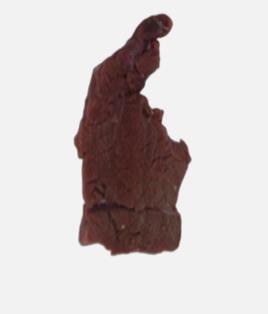
Image
capture and extraction of CIEL*a*b* coordinates in the VAS
The image capture process performed by the VAS is
fundamental for the acquisition of visual data that will be used in the
analysis of the color of the spines and subsequent analysis. Figure 3 shows the
different stages performed in SVA during image capture, calibration, and
segmentation. Initially, the environment and the sample of bovine loins were
prepared, ensuring optimal illumination and alignment conditions that allowed
an accurate capture of the image (figure 3a). The focal length and optical
center obtained in the camera calibration matrix are presented in table 2.
These values are used in the calibration function to obtain a better image
resolution at the time of capture and compare with the image obtained in the
uncalibrated camera.
The image was captured using the Logitech PRO C920
camera, and an analysis process was performed to reduce noise and improve its
quality. Contrast and color correction adjustments were also made to optimize
its usefulness in subsequent analyses (figure 3b). Once the previous process
was finished, image segmentation was performed to identify the region of
interest (ROI) within the complete image of the bovine loin obtained (figure
3c). This segmentation involved using advanced image processing techniques, such
as thresholding and feature detection, to distinguish the ROI from the
background and other irrelevant elements. The identified region of interest
becomes the main focus of further analysis and applications, allowing feature
detection, pattern recognition, and decision-making based on accurate and
relevant visual information.
|
|
|
|
|
a)
Uncalibrated image
|
b) Calibrated image
|
c) Segmented image
|
Figure
3. Image
of bovine loin a) before and b) after the calibration process, and c) segmented
image
Once
the previous steps were completed, the measurement was performed, and the
values of the parameters L*, a*, and b* were extracted from the image obtained
from the bovine loin. The image acquired by Python 3.9 software was converted
from RGB space to CIEL*a* b* space, using equations (1), (2), and (3) presented
in table 3. The system calculates the mean of the Luminance (L*), red-green
(a*), and yellow-blue (b*) coordinates. Finally, the user will be able to
visualize in the interface the two components facing the original image of
bovine loins during the days (0-6) of storage at four °C, as presented in table
4.
Comparison
between the color measurements obtained in the Machine Vision System (SVA) and
the Minolta CR-400 Colorimeter (CM)
The
color coordinates L*, a*, and b*, obtained in the VAS, were compared with those
obtained in the CM and presented in table 4. In order to obtain the color
values in the CM, it was necessary to take measurements in several sections of
the sample and obtain average values because the analysis area of the
colorimeter is approximately 8 mm in diameter and was not able to cover the
total area of the meat samples, connective tissue and intramuscular fat that
could influence the colorimetric characteristics of the lean part of these
(Girolami et al., 2013).
|
Table 4. CIEL* a* b* coordinates in beef loin samples during storage
time at four °C, acquired in the Machine Vision System (SVA) and the Minolta
CR-400 Colorimeter (CM)
|
|
Sample
|
Storage
time
|
CIEL
coordinate values *a* b*
|
|
SVA
|
CM
|
|

|
|
L*: 59.61186178
|
L*: 60.48523865
|
|
Día 0
|
a*: 5.3776992
|
a*: 5.96368978
|
|
|
b*: -8.3727804
|
b*: -9.44569322
|
|

|
|
L*: 58.27551214
|
L*: 58.26325783
|
|
Día 1
|
a*: 5. 64158818
|
a*: 5.
89857451
|
|
|
b*: -9.77889147
|
b*: -10.80364578
|
|

|
|
L*: 50.12012421
|
L*: 49.85823695
|
|
Día 2
|
a*: 2.64234985
|
a*: 2.59834857
|
|
|
b*: -4.39190818
|
b*: -5.52364735
|
|

|
|
L*: 51.35447075
|
L*: 50.56891525
|
|
Día 3
|
a*: 2.35686958
|
a*: 2.56457985
|
|
|
b*: -4.21038999
|
b*: -4.32659524
|
|
|
|
L*: 61.63334934
|
L*: 50.85621394
|
|
Día 4
|
a*: 3.06043796
|
a*: 3.84785622
|
|
|
b*: -4.96354232
|
b*: -5.29425367
|
|

|
|
L*: 48.91479247
|
L*: 49.09458236
|
|
Día 5
|
a*: 2.94847217
|
a*: 3.52584793
|
|
|
b*: -4.34895065
|
b*: -3.95864127
|
|

|
|
L*: 48.23733609
|
L*: 48.18945633
|
|
Día 6
|
a*: 1.46530337
|
a*: 1.98647817
|
|
|
b*: -2.86972267
|
b*: -3.99857426
|
Samples:
Bovine loins, Equipment: SVA: machine vision system, CM Minolta colorimeter,
storage time (Dia 0-6), L*, a* and b* color coordinates.
The values obtained in the VAS of beef loin samples
represent the sample as a whole. They can be observed from the equipment
monitor, making it possible to guarantee homogeneous measurements of the lean
parts or those of interest to the researcher. The values obtained for the L*
coordinate showed similar trends in the two measuring devices for the beef
tenderloin samples. This coordinate is related to the total pigment contained
in the meat, making the product darker or more opaque, as can be seen in table 4.
The values of L* decrease with storage time, indicating that L* is useful for
differentiating the color between meat samples during storage time (Xing et
al., 2007).
The a* coordinate is related to myoglobin content,
and the b* coordinate is related to myoglobin states (Perez et al., 1998). The
values obtained for the a* and b* coordinates showed significant differences
between the two measuring devices. They decreased during the first hours of
storage, corresponding to the meat's oxidation stage, causing more pronounced
changes in b*; this behavior can also be attributed to the reflected and
refracted light of the myoglobin and myoglobin layers (Girolami et al., 2013).
Another factor that could influence the values obtained for a and b* is
attributed to the methodology used for image capture in the Minolta Colorimeter
and to factors such as breed, cattle feed, and slaughter process that affect
the oxidation process of myoglobin and, therefore, the color of the meat
samples during storage time.
The processes described above, from constructing the
electronic machine vision system to designing the software for color analysis
in bovine loins, have culminated in significant and promising results. These
results clearly show the feasibility and efficacy of the system developed for
color evaluation in fresh and stored beef samples.
CONCLUSIONS
The color values obtained through the application of
the CIEL*a*b* coordinates and their comparison with the Minolta CR-400
Colorimeter in the samples of fresh beef loins and during the storage time did
not present significant statistical differences about the L* values, the values
obtained for a* and b* presented statistical differences attributed to the
methodology used for the capture of the image in the Minolta Colorimeter and to
factors specific to beef.
The results established that the artificial vision
system can measure fresh beef loins' color during storage time in a simple,
fast, non-invasive, real-time, and low-cost manner.
This technological tool will allow meat producers,
marketers, and processors to take appropriate management measures to obtain
quality products with high consumer acceptance. It also constitutes, at
present, an important open field of research and an excellent opportunity for
electronics and agribusiness, aiming at the generation of science and
technology itself.
BIBLIOGRAPHIC REFERENCES
1. Altmann, B. A.,
Gertheiss, J., Tomasevic, I., Engelkes, C., Glaesener, T., Meyer, J., Schäfer,
A., Wiesen, R., & Mörlein, D. (2022). Human perception of color differences
using computer vision system measurements of raw pork loin. Meat science, 188,
108766. https://doi.org/10.1016/j.meatsci.2022.108766
2. Anilkumar, K. K.,
Manoj, V. J., & Sagi, T. M. (2021). Efficacy of CIEL*a*b* and cmyk color
spaces in leukemia image analysis: a comparison by statistical techniques.
Biomedical Engineering: Applications, Basis and Communications, 33(06),
2150042. http://dx.doi.org/10.4015/S1016237221500423.
3. Arsalane, Assia
& Klilou, Abdessamad & Noureddine, El Barbri & Abdelmoumen,
Tabyaoui. (2020). Artificial vision and embedded systems as alternative tools
for evaluating beef meat freshness. 1-6.
10.1109/ICOA49421.2020.9094503.
4. Castellanos Tolosa, N y
Sánchez Jiménez, M. (2022). Desarrollo de carne de hamburguesa a base de harina
de grillo. Universidad de los Andes. Disponible en: http://hdl.handle.net/1992/55654.
5. Girolami, A., Napolitano, F.,
Faraone, D., & Braghieri, A. (2013). Measurement of meat color using a computer vision system.
Meat science, 93(1), 111–118. https://doi.org/10.1016/j.meatsci.2012.08.010.
6. Larraín, R.,
Schaefer, D., Reed, J. (2008). Use of digital images to estimate CIE color
coordinates of beef. Food Research International, 41(4), 380-385. DOI:
10.1016/j.foodres.2008.01.002.
7.
Modzelewska-Kapituła, M., & Jun, S. (2022). The application of computer
vision systems in meat science and industry–A review. Meat Science, 192,
108904. DOI: 10.1016/j.meatsci.2022.108904.
8. Nasiri, A., &
Mohi, K. (2021). A machine vision-based system for measuring the chromatic
parameters of bell pepper using artificial neural networks.
9. Parra-Bracamonte, G. M., López-Villalobos,
N., Vázquez-Armijo, J. F., Magaña-Monforte,
10. J. G., Martínez-González, J.
C., & Moreno-Medina, V. R. (2021). Perspectivas Del Consumidor Mexicano
Sobre La Calidad De La Carne De Bovino. Perspectives Of Mexican Consumer on Beef Quality. Tropical
and Subtropical Agroecosystems, 24,85. DOI:
http://dx.doi.org/10.56369/tsaes.3702.
11. Pérez-Álvarez, J. A.;
Fernández-López, J.; Sayas-Barberá, M. E.; Cartagena-García, R. (1998).
Caracterización de los parámetros de color de diferentes materias primas usadas
en la industria cárnica. Eurocarne 63, 115-122
12. Salueña, B. H., Gamasa, C.
S., Rubial, J. M. D., & Odriozola, C. A. (2019). CIELAB color paths during meat shelf life. Meat science,
157, 107889. DOI: 10.1016/j.meatsci.2019.107889.
13. Santos, M. D., Castro, R.,
Delgadillo, I., & Saraiva, J. A. (220). Improvement of the refrigerated preservation technology by
hyperbaric storage for raw fresh meat. Journal of the Science of Food and
Agriculture, 100(3), 969-977. DOI: 10.1002/jsfa.10083.
14. Sanmartín, P., Fuentes, E.,
Serrano, M., & Prieto, B. (2021). Methodological
aspects for the determination of color in soil-plant relationship studies.
15. Sun, X., Young,
J., Liu, J. H., & Newman, D. (2018). Prediction of pork loin quality using
online computer vision system and artificial intelligence model. Meat science,
140, 72–77. https://doi.org/10.1016/j.meatsci.2018.03.005.
16. Wu, D., Sun, D.
(2013). Colour measurements by computer vision for food quality control A
review. Trends in Food Science and Technology, 29(1), 5-20. https://doi.org/10.1016/j.tifs.2012.08.004.
17. Wyszecki, G.,
& Stiles, W. S. (2000). Color science. Concepts and methods, quantitative
data and formulae Jonh Wiley and Sons, Inc Second.
18. Zaukuu, J. L. Z.,
& Tsyawo, E. C. (2024). Rapid and non-destructive detection of ponceau 4R
red colored pork. Meat Science, 209, 109400. 10.1016/j.meatsci.2023.109400.
FINANCING
No financing.
CONFLICT OF INTEREST
The authors declare that there is
no conflict of interest.
AUTHORSHIP CONTRIBUTION
Formal analysis:
Olga Lucía Torres Vargas; Mateo Valencia Buitrago.
Supervision: Olga
Lucía Torres Vargas; Mateo Valencia Buitrago.
Display: Olga
Lucía Torres Vargas; Mateo Valencia Buitrago.
Drafting - original
draft: Olga Lucía Torres Vargas; Mateo Valencia
Buitrago.
Writing - proofreading
and editing: Olga
Lucía Torres Vargas; Mateo Valencia Buitrago.