doi: 10.62486/latia2024105
ORIGINAL
Classification of tomato ripeness in
the agricultural industry using a computer vision system
Clasificación de la madurez de tomates
en la industria agrícola mediante un sistema de visión artificial
Mateo Valencia Buitrago1 *, Olga Lucía Torres Vargas2 *
1Universidad
del Quindío, Ingeniería Electrónica, Facultad de Ingeniería. Colombia.
2Universidad
del Quindío, Ingeniería de Alimentos, Instituto Interdisciplinario de las
Ciencias. Colombia.
Cite as: Valencia
Buitrago M, Torres Vargas OL. Classification of tomato ripeness in the
agricultural industry using a computer vision system. LatIA. 2024; 2:105. https://doi.org/10.62486/latia2024105
Submitted: 05-02-2024
Revised: 11-05-2024 Accepted: 15-08-2024
Published: 16-08-2024
Editor: Prof.
Dr. Javier González Argote 
ABSTRACT
Machine vision systems (SVA) occupy an
important place in the field of food and agriculture, these techniques are
performed in situ, are efficient, non-invasive, time-saving and more economical
than traditional techniques. Tomatoes (Solanum lycopersicum) are extensively
cultivated throughout the world, are essential in the agricultural and culinary
fields and are recognized for their beneficial contributions to health. Lack of
knowledge about fruit maturity, proper harvesting and postharvest handling are
factors responsible for large postharvest losses. Therefore, the objective of
this research was the construction of a VAS that allows establishing
relationships between color and maturity stage of the Chonto Roble F1 tomato.
The VAS built is composed of hardware and software duly synchronized through
the application of computer vision algorithms in Python 3.9 software that allow
it to perform the acquisition and segmentation of the image and present the
user with the color coordinates in the CIEL*a*b* system. Finally, color
measurements were performed on tomato samples at different stages of ripening
in the VAS and a HunterLab ColorQuest XE (EHL) spectrophotometer. The results
obtained indicated that there are no significant differences in both
measurement systems for L* values, the changes produced in b* and a* were
statistically significant for tomato samples. The results obtained indicated
the potential use of the constructed VAS for the determination of the degree of
maturity of tomatoes in real time, in a non-invasive and low-cost way.
Keywords: Image Analysis; CIEL*a*b*; Spectrophotometer; Machine Vision
System; Tomato.
RESUMEN
Los sistemas de visión artificial (SVA) ocupan un lugar
importante en el campo de la alimentación y la agricultura, estas técnicas se
realizan en sitú, son eficientes, no invasivas, ahorran tiempo y son más
económicas que las técnicas tradicionales. Los tomates (Solanum
lycopersicum), son cultivados extensivamente en
todo el mundo, son esenciales en el ámbito agrícola y culinario y son reconocidos por sus aportes
benéficos a la salud. La falta de conocimiento sobre la madurez del fruto, una
cosecha adecuada y el manejo postcosecha son factores responsables de grandes
pérdidas postcosecha. Por lo tanto, el objetivo de esta
investigación fue la construcción de un SVA que permite establecer relaciones
entre el color y el estado de madurez del tomate Chonto Roble F1. El SVA
construido está compuesto por un hardware y un software debidamente sincronizados
mediante la aplicación de algoritmos de visión computacional en el software
Python 3.9 que le permiten realizar la adquisición y segmentación de la imagen
y presentar al usuario las coordenadas de color en el sistema CIEL*a*b*.
Finalmente fueron realizadas medidas de color en muestras de tomate con
diferentes estados de maduración en el SVA y un espectrofotómetro HunterLab
ColorQuest XE (EHL). Los resultados obtenidos indicaron que no hay diferencias
significativas en ambos sistemas de medida para los valores de L*, los cambios
producidos en b* y a* fueron estadísticamente significativos para las muestras
de tomate.
Los resultados obtenidos indicaron el potencial uso del SVA construido, para la
determinación el grado de madurez de tomates en tiempo real, de una forma no
invasiva y a bajo costo.
Palabras
clave: Análisis de Imagen; CIEL*a*b*; Espectrofotómetro;
Sistema de Visión Artificial; Tomate.
INTRODUCTION
Tomatoes,
grown extensively throughout the world, are valuable not only for the
livelihood they provide to farmers and consumers but also for their health
benefits, containing vitamin C and lycopene (Ciptaningtyas et al., 2022), the
latter of which can reduce the risk of breast and prostate cancer,
osteoporosis, cardiovascular disease and reduce high blood pressure (Przybylska
&Tokarczyk, 2022). However, a lack of knowledge about maturity and
postharvest handling contributes to growers' huge losses today. The assessment
of tomato maturity and quality depends largely on the external characteristics
of the fruit; its assessment can be done using non-invasive methods (Ninja
& Manuj-Kumar, 2022). Assessing maturity and harvesting a product at the
right stage is an art that differs from crop to crop; maturity is an
irreversible process that directly affects the internal and external quality of
the fruit (Prasad et al., 2018). During tomato cultivation, it is common to
consider six stages for tomato color ripening (Maturity and ripening stages):
green, brittle, turning, pink, light red, and red; in addition to the
development of flavor, texture, and aroma, these ripening stages in tomatoes
occur from greenhouse or growing plot, transportation, purchase, shelf, refrigeration
to consumption (Hongli et al., 2023).
Electronic
machine vision systems (EVS) represent an emerging technique in food and
agriculture; they play an important role in solving practical problems of
automatic sorting and recognition. These techniques have surpassed manual labor
and are non-invasive, time-saving, economical, rigorous, and accurate. Research
using VAS for color assessment in food has focused on the conversion of images
obtained using the RGB color measurement system to the CIEL*a*b* system
(Larraín et al., 2008); several approaches have been explored in this field,
including the examination of color indices about tomato ripeness and the use of
image processing. Khan et al. 2011 conducted studies for tomato maturity
recognition with convolutional transformers, Konagaya et al. 2020 monitored the
quality of ripe tomato (red stage) during storage using image processing images
red) during storage using ultraviolet light-induced visible fluorescence
imaging, Changxia et al. (2021) formulated a tomato ripeness recognition
algorithm based on a multilevel deep residual network, Nassiri et al. (2022)
used fuzzy logic classification on ripe tomatoes based on physical property
fusion. Sharma et al. (2020) implemented a ripening index for color-based
evaluation of the ripening behavior of tomato fruits. Color assessment should
be performed consistently and objectively to obtain reliable and reproducible
results that reflect human perception and can be performed in a non-invasive
manner (Wu et al., 2013). Therefore, this research's objective was to construct
a VAS that establishes relationships between color images in CIEL*a*b*
coordinates and the maturity stage of the Chonto Roble F1 tomato.
METHOD
For
the development of the research presented below, a machine vision system (SVA)
was built and implemented to classify tomatoes by their maturity stage based on
the CIEL*a*b* color spaces (1986).
Raw material
Tomatoes
(Solanum lycopersicum) of Roble F1 variety, harvested from farms in the Quindío
region, representing an important part of the department's economy, were used
as raw material. The color of the pericarp visually classified the tomatoes,
applying the ripening stage criteria established by the Colombian Technical
Standards ICONTEC for tomatoes (NTC 1103-1). Once selected, these were analyzed
in the SVA and EHL.
Machine Vision
System (SVA)
To
carry out the process of taking color images of the tomato samples, a VAS was
built using a low-cost Logitech PRO C920 Full HD digital camera, graphic
processing units (GPU), data storage devices, and an illumination device
(series of LEDs)—the programming of the hardware.
The
hardware measurement system was programmed using Python 3.9. Both systems,
properly synchronized, are responsible for presenting to the user the CIEL*a*b*
coordinates of tomato samples with different days of ripening.
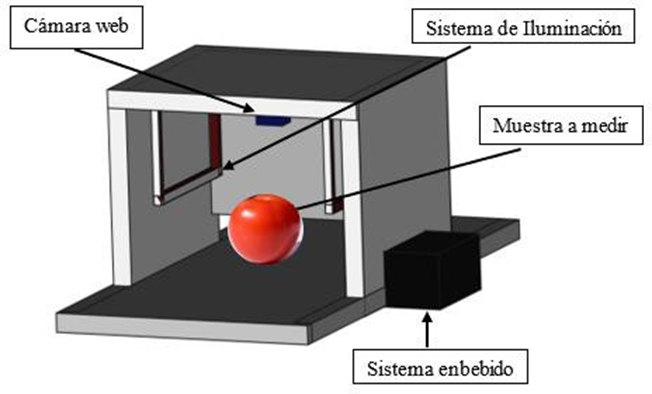
Figure 1. Machine Vision System
(SVA) for the measurement and analysis of color in tomato samples
For the implementation of the VAS, we
proposed the design of software that allows the calibration of the camera and
the detection of the color of tomatoes with different degrees of ripeness,
following the steps shown in figure 2.
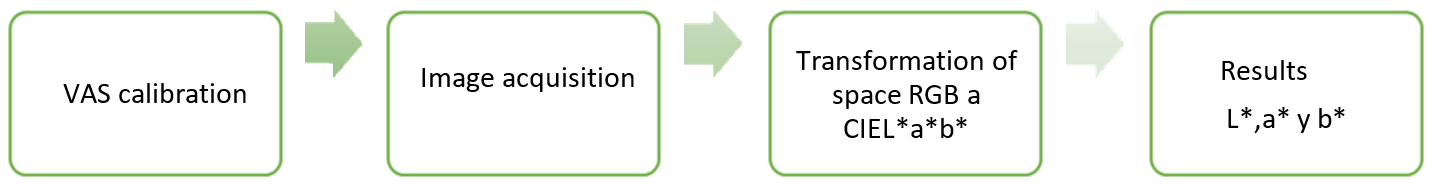
Figure 2. Stages established in the design and construction of the
software for the Machine Vision System (SVA)
The
backbone of the VAS consists of an embedded system, implemented in a Raspberry
Pi 4, running the Raspberry Pi OS operating system, which is in charge of capturing
the image, segmenting it, resizing it, storing it, and delivering a response in
terms of CIEL*a*b* coordinates to the user (Valencia, 2023).
Prior
to image capture, a calibration stage was performed. The color was determined
using a Logitech PRO C920 camera, which offers advantages such as the capture
of a large amount of spatial information, the ability to measure surfaces of
various sizes, the availability of a wide range of models at more affordable
prices, and not require direct contact with the surface to be measured.
However, using theoretical models, the information obtained in color space Red,
Green, and Blue (RGB) must be transformed to CIEL*a*b* color space (Castellanos
et al., 2022). The parameters and equations used at this stage are presented in
table 1.
|
Table 1. Color characterization in tomato: equations and specialized
equipment.
|
|
Parameters
|
Equations
|
Color measurement
equipment
|
|
Brightness: L*
|
L* = 116 (Y1/3/Yn)− 16 Ec.(1)
|
|
|
Coordinate coordinate: a*
|
a* = 500 [(X1/3/Xn)−
(Y1/3/Ym)] Ec. (2)
|
|
Coordinate coordinate: b*
|
b* = 200 [(Y1/3/Yn)
− (Z1/3/Zn)] Ec. (3)
|
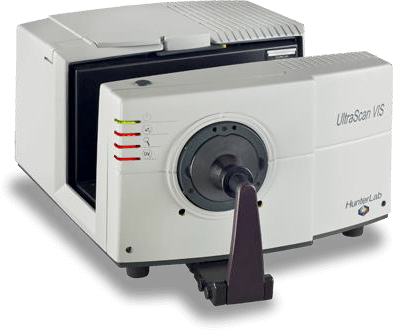
HunterLab
Spectrophotometer
ColorQuest XE (EHL).
|
In
order to establish a comparison parameter, color measurements were made in the
VAS and EHL on tomatoes with different degrees of ripening (table 3). The
coordinates L*, a*, b* in the EHL system were taken using a D65 lamp, 1 cm
diameter aperture, and a 2° standard observer at five points on the pericarp of
each tomato sample and the values reported were calculated as the average of
these measurements. The determination and expression of color were carried out
based on CIEL*a*b* coordinates (table 1) and reflectance values (CIE, 1986),
obtaining the parameters of Luminosity (L), red-green (a*), yellow-blue (b*)
directly from the equipment.
Statistical
analysis
To
establish if there are differences between the color measurements made by the
SVA and the EHL, an analysis of variance (ANOVA- Multifactorial) by least
significant difference (LSD) with p-value ≤ 0.05 was performed, with three
interaction factors, taking as response variables the coordinates L*, a*, b*,
and as a factor: the degree of maturation. This analysis was performed using
the statistical package Stratigraphic ® Plus, Centurion.15.2.12 XV (Numagistics
Ltda).
RESULTS
AND DISCUSSION
Once
the construction of the electronic system and the programming of the VAS
hardware measurement system in its structural form were completed, a
compartment was built for image acquisition, which functions as the main
structure of the equipment, supports the tomato sample to be analyzed and the
other components, as can be seen in figure 1.
The
image is captured by the Logitech PRO C920 camera and subjected to an analysis
process to reduce noise and improve its quality; contrast and color correction
adjustments were also made to optimize its usefulness in subsequent analyses.
After the previous stage, the image was segmented to identify the region of
interest (ROI) within the obtained tomato image. This segmentation involved
advanced image processing techniques, such as thresholding and threshold
detection.
This
segmentation involved using advanced image processing techniques such as
thresholding and feature detection to distinguish the ROI from the background
and other irrelevant elements. The identified region of interest becomes the
main focus of further analysis and applications, allowing feature detection,
pattern recognition, and decision-making based on accurate and relevant visual
information.
The
acquired image is processed by Python 3.9 software and converted from RGB space
to CIEL*a*b* space using equations (1), (2), and (3) presented in table 1. The
system computes the mean of the Luminance (L*), red-green (a*), and yellow-blue
(b*) coordinates. Finally, the user will be able to visualize both components
facing the original tomato image in the interface, and this information will be
stored on the computer.
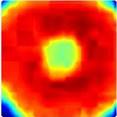
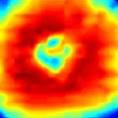
Table
2 shows the L*, a*, and b* coordinates obtained in the epicarps of the six
tomato samples analyzed with different degrees of ripening in the SVA and EHL.
The tomato ripening process is characterized by a high synthesis of carotenoids
that generates changes in the L*, a*, and b* coordinates (Artés-Calero &
Artés-Hernández, 2004). The* coordinate presented significant changes; samples
1 and 2 presented negative values (green color) that progressively became
positive (red color). López-Camelo et al. (2003) point out that during tomato
ripening, phytoene (colorless) is initially synthesized, to later give rise to
ζ-carotene (pale yellow), lycopene (red), β-carotene (orange) and xanthophylls
and hydroxylated carotenoids (yellow); as we can observe in samples 3 and 4.
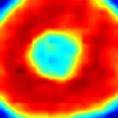
The
synthesis of yellowish pigments precedes reddish pigments, but the massive
accumulation of the latter masks the former. When the red pigments began to be
synthesized, a decrease in the values of the L* coordinate occurred, indicating
a darkening or decrease in brightness, as seen in samples 5 and 6 (table 3).
The changes in the b* coordinate were not significant.
Table
3 shows the values for L*, a*, and b* coordinates obtained in the VAS and EHL
for tomatoes at different maturity levels. The values obtained do not show
significant differences, indicating the potential use of the VAS in the
selection of tomatoes by maturity level.
Table
3. Results for L*, a* and b* coordinates
obtained in the VAS and EHL for tomatoes at different maturity levels
|
|
Sistema de Visión Artificial
|
HunterLab Spectrophotometer
|
|
Samples
|
L*
|
a*
|
b*
|
L*
|
a*
|
b*
|
|
1
|
85,42±0,35
|
-10,06±0,16
|
70,73±0,68
|
82,19±0,44
|
-9,06±0,09
|
68,21±0,08
|
|
2
|
81,58±0,19
|
-5,68±0,13
|
71,25±1,05
|
80,71±0,70
|
-6,25±0,72
|
67,17±1,20
|
|
3
|
78,99±0,59
|
12,56±0,98
|
72,25±0,74
|
76,14±0,04
|
8,56±0,95
|
69,54±0,91
|
|
4
|
70,23±0,52
|
21,68±0,53
|
73,80±0,60
|
69,4±0,06
|
20,15±0,90
|
68,70±0,08
|
|
5
|
66,05±0,27
|
31,47±0,31
|
73,28±0,94
|
65,97±0,19
|
33,62±1,06
|
69,12±0,02
|
|
6
|
62,28±0,03
|
43,93±0,07
|
70,41±0,70
|
60,57±1,05
|
44,08±1,53
|
68,32±0,21
|
The
results obtained made it possible to evaluate the use of the VAS constructed to
determine color as a parameter for classifying the ripening stage of tomatoes
in a non-invasive, economical, and real-time manner. Farmers can use this technological
tool to inspect, classify, and estimate the maturity of fruit and vegetable
products and determine the optimum time to harvest them, increasing their
productivity and strengthening the Colombian fruit and vegetable chain.
CONCLUSIONS
The
methodology used by the developed VAS allows for analyzing the global color of
the sample and its heterogeneity, captures, processes, analyzes the images, and
evaluates the color non-invasively, using the CIEL*a*b* coordinates. This
system offers the possibility of analyzing the entire surface of the product,
its characteristics, and defects, allowing you to estimate the state of
maturity quickly and at a low cost, factors that differentiate it from a
commercial spectrophotometer. The images obtained allow the farmer to classify
unripe, ripe, and overripe fruit for subsequent marketing or agro-industrial
processing.
BIBLIOGRAPHIC REFERENCES
1.
Artés-Calero, F., Artés-Hernández, F. 2004. Tratamientos postrecolección del
tomate fresco. Tendencias e innovaciones, Capítulo 10, pp. 109-120. In:
Tomates. Producción y comercio. Ediciones de Horticultura S.L. Reus, España.
ISBN 84- 87729-48-7.
2.
Castellanos Tolosa, N y Sánchez Jiménez, M. (2022). Desarrollo de carne de
hamburguesa a base de harina de grillo. Universidad de los Andes. Disponible
en: http://hdl.handle.net/1992/55654.
3.
Changxia Li, Xuemei Hou, Nana Qi, Huwei Liu, Yihua Li, Dengjing Huang, Chunlei
Wang, Weibiao Liao. (2021). Insight
into ripening-associated transcription factors in tomato: A review, Scientia
Horticulturae,Volume, 288,110363. https://doi.org/10.1016/j.scienta.2021.110363
4.
Ciptaningtyas, D., N. Benyakart, H. Umehara, M. Johkan, N. Nakamura , M. Nagata
, T. Orikasa , M. Thammawong , T. Shiina. (2022)
Modelado del patrón de maduración metacrónica del tomate verde maduro afectado
por el cultivo y la temperatura de almacenamiento Ciencia. Rep., 12, pág. 8241 , https://doi.org/10.1038/s41598-
022-12219-z.CIE (1986) Colorimetry. 2nd Ed. CIE 15.2: Viena
5.
Larraín, R., Schaefer, D., Reed, J. (2008). Use of digital images to estimate
CIE color coordinates of beef. Food Research International, 41(4), 380-385.
6.
Hongli Li, Gangshuai Liu, Daqi Fu. (2023).Transcriptional regulation of tomato
fruit quality, Postharvest Biology and Technology,Volume 202,112393, https://doi.org/10.1016/j.postharvbio.2023.112393.
7.
López-Camelo, A.L., Gómez, P., Artés, F. (2003). Use of a* and b* colour parameters to assess the effect of
some growth regulators on carotenoid biosynthesis during postharvest tomato
ripening. Acta Horticulturae 599:305-308.
8.
Nassiri, S. M., Tahavoor, A., & Jafari, A. (2022). Fuzzy logic
classification of mature tomatoes based on physical properties fusion.
Information Processing in Agriculture, 9(4), 547-555. DOI:
2017.63807ijbse10.22059
9.
Ninja Begum, Manuj Kumar Hazarika. (2022).Maturity detection of tomatoes using
transfer learning, Measurement: Food, Volume 7,100038. https://doi.org/10.1016/j.meafoo.2022.100038.
10.
Instituto Colombiano de Norma Tecnica y Certificaión. Industria Alimentaria:
Tomate de Mesa. Bogotá, D.C.: ICONTEC, 1995. Bogotá, D.C.: ICONTEC, 1976.
(Norma Técnica Colombiana; NTC- 1103-1).
11.
Khan, A., Hassan, T., Shafay, M., Fahmy, I., Werghi, N., Mudigansalage, S.,
& Hussain, I. (2023). Tomato maturity recognition with convolutional
transformers: Scientific Reports. Sci. Rep., 13(1). https://doi.org/10.1038/s41598-023-50129-w
12.
Konagaya, Keiji., Dimas Firmanda Al Riza, Sen Nie, Minori Yoneda, Takuya
Hirata, Noriko Takahashi, Makoto Kuramoto, Yuichi Ogawa, Tetsuhito Suzuki,
Naoshi Kondo. (2020), Monitoring mature tomato (red stage) quality during
storage using ultraviolet-induced visible fluorescence image, Postharvest
Biology and Technology, Volume 160,111031. https://doi.org/10.1016/j.postharvbio.2019.111031.
13.
Prasad, K., Sanu Jacob, Mohammed Wasim Siddiqui, Chapter 2 - Fruit Maturity,
Harvesting, and Quality Standards, Editor(s): Mohammed Wasim Siddiqui,
Preharvest Modulation of Postharvest Fruit and Vegetable Quality, Academic
Press, 2018, Pages 41-69, https://doi.org/10.1016/B978-0-12-809807-3.00002-0.
14.
Przybylska, S., & Tokarczyk, G. (2022). Lycopene in the Prevention of
Cardiovascular Diseases. International journal of molecular sciences, 23(4),
1957. https://doi.org/10.3390/ijms23041957
15.
Sharma, L. K. Ramesh , V. Paul , R. Pandey.( 2020
). Índice de maduración: un mejor parámetro para la evaluación basada en el
color del comportamiento de maduración de los frutos de tomate. Fisiol vegetal.
Rep. , 25, págs . 171-177 , https://doi.org/10.1007/s40502-020-00499-4
16.
Valencia, M. (2023). Desarrollo de un sistema de visión artificial para el
monitoreo de los cambios de color en lomos de bovino. [Tesis,Universidad del
Quindio]. bdigital.uniquindio.edu.co.
17.
Wu, D., Sun, D. (2013). Colour
measurements by computer vision for food quality control A review. Trends in
Food Science and Technology, 29(1), 5-20. https://doi.org/10.1016/j.tifs.2012.08.004.
FINANCING
The
authors did not receive financing for the development of this research.
CONFLICT OF INTEREST
The
authors declare that there is no conflict of interest.
AUTHORSHIP CONTRIBUTION
Conceptualization:
Mateo Valencia Buitrago, Olga Lucía Torres Vargas.
Investigation:
Mateo Valencia Buitrago, Olga Lucía Torres Vargas.
Methodology:
Mateo Valencia Buitrago, Olga Lucía Torres Vargas.
Drafting
- original draft: Mateo
Valencia Buitrago, Olga Lucía Torres Vargas.
Writing
- proofreading and editing: Mateo
Valencia Buitrago, Olga Lucía Torres Vargas.