doi: 10.62486/latia202493
ORIGINAL
Prediction of Flight Areas using Machine Learning Algorithm
Predicción de áreas de vuelo mediante un algoritmo de aprendizaje automático
Khushwant Singh1
![]() *, Mohit Yadav2
*, Mohit Yadav2
![]() *, Vugar Hacimahmud Abdullayev3
*, Vugar Hacimahmud Abdullayev3
![]() *
*
1Computer Science and Engineering, University Institute of Engineering & Technology, Maharshi Dayanand University. Rohtak, 124001.
2Department of Mathematics, University Institute of Sciences, Chandigarh University. Mohali, 140413, India.
3Department of Computer Engineering, Azerbaijan State Oil and İndustry University. Azerbaijan.
Cite as: Singh K, Yadav M, Hacimahmud Abdullayev V. Prediction of Flight Areas using Machine Learning Algorithm. LatIA. 2024; 2:93. https://doi.org/10.62486/latia202493
Submitted: 03-02-2024 Revised: 09-05-2024 Accepted: 24-08-2024 Published: 25-08-2024
Editor:
Prof.
Dr. Javier González Argote ![]()
Corresponding Author: Vugar Hacimahmud Abdullayev *
ABSTRACT
Anyone who often uses the airways wants to predict when it will be best to purchase a ticket in order to get the best possible value. Aircraft firms continuously adjust ticket prices in an effort to maximize profits. When it’s anticipated that demand for more income will grow, aircraft manufacturers may raise flying prices. Information analysis for a given air route, comprising the features like take-off time, entrance time, and airways during a specified period, has been gathered in order to decrease costs. To use the machine learning models, qualities are arranged based on the information that has been gathered. The machine learning approach to determine costs based on attributes is presented in the paper below.
Keywords: Machine Learning; Linear Regression; SVM; Decision Tree; KNN.
RESUMEN
Cualquiera que utilice a menudo las líneas aéreas quiere predecir cuándo será mejor comprar un billete para obtener el mejor valor posible. Las empresas aeronáuticas ajustan continuamente los precios de los billetes en un esfuerzo por maximizar los beneficios. Cuando se prevé que aumentará la demanda de ingresos, los fabricantes de aviones pueden subir los precios de los vuelos. Para disminuir los costes, se ha recopilado información de análisis de una ruta aérea determinada, que incluye características como la hora de despegue, la hora de entrada y las rutas aéreas durante un periodo determinado. Para utilizar los modelos de aprendizaje automático, se ordenan las cualidades en función de la información que se ha recopilado. A continuación se presenta el enfoque de aprendizaje automático para determinar los costes en función de los atributos.
Palabras clave: Aprendizaje Automático; Regresión Lineal; SVM; Árbol de Decisión; KNN.
INTRODUCTION
The structure of purchasing a ticket so many days ahead of the scheduled departure date is not affected by exceptional fees.(1,2,3) Generally speaking, a lot of flying schools disagree with this prediction method.(4,5,6) When there are fewer available tickets, airline associations may decide to raise the price in order to cover their advertising costs.(7,8,9) From the standpoint of the customer, the best time to buy an airline ticket is crucial since they have no idea how much the tickets will cost in the future.(10,11,12) The manner, the month, the time, the location, the arrival and departure times, the source, the destination, the airline, and whether the day of departure falls on a holiday or on a regular day all affect how much the rates fluctuate.(13,14,15) There is one exception to the general pricing trend: tickets from tier-1 to tier-1 cities have non-increasing costs as the departure date approaches.(16,17,18) Additionally, the information indicates the time of day when the prices will be at their highest. We need to estimate the customer’s minimum fare.(19,20,21,22)
Literature Survey
Customers may find it difficult to purchase and discuss tickets at the lowest possible price at times.(23,24,25,26,27) Strategies are looked into for the customer in order to ascertain the best time and day to confiscate and discuss tickets that have the lowest passage rate.(28,29,30,31) Most of these frameworks make use of the contemporary computer framework known as machine learning. Fractional Slightest Square Regression (FLSR) was misapplied by Gini and Groves to construct a model in order to determine the ideal time to purchase a plane ticket.(32)
Between January 22, 2012, and July 24, 2012, the majority of the travel company booking destinations provided the data. For the final performance, more data was gathered and will be analyzed to verify the connections between the presentations. Some researcher performed a hunger example using the Direct Mixed Relapse technique for the San Francisco–California route, where www.infare.com provides daily airfares. The display is created by combining two highlights, such as the number of days for departure and whether the trip is on a weekday or at the end of the week. The presentation predicts flight times far in advance of the actual day of departure. However, the program closes the takeoff date rather than convincing in a situation for an overseas time assignment. Wohlfarth offered a ticket acquisition time advancement demonstration that was contingent upon a quantifiable examination framework, information mining systems (including activity and collecting), and a notable pre-processing known as macked point processors.(33) It is suggested that this method change various incorporated esteem courses of action into included esteem course of action headings that might return to estimation of lone gathering. This respect heading is forced into the meeting based on careful behavior assessment. Changes in esteem lead to modifications in planning. The best arrangement group and a short period subsequently for seeing the movement exhibition were selected using a tree-based analysis. Dominguez-Menchero’s analysis suggests that the conclusion be made by timing based on a nonparametric isotonic backslide technique for a certain path, carrier, and time frame. The program provides the maximum number of days that are suitable, sometimes even before purchasing a plane ticket.(34) The example takes into account two different types of variables, including the section and the acquisition date.(35,36)
Data Collection
The first important part of this meander is the hoarding of knowledge. The variety of data about unique areas is useful in generating pre-made models. Locations provide information on the different routes, including arrival and departure times, aircraft, and fees. There are several sources to choose from for information gathering, ranging from application programming interfaces to client vacation locations. This section provides a general discussion of variables and data gathered from various sources. In order to verify this, data is gathered from Kaggle.com and models are implemented using Python. After gathering data from the location, the script outputs a record with comma-separated values. Highlights and nuanced information may be found in the archive. Choosing the key elements needed to compute the expected flight expenses is an important point of view. The location’s surrender incorporates a multitude of elements specific to each flight: The suitable components are the Time of Arrival, Date Journey, Time and Place of Departure, Airway Company, Place of Destination/Arrival, and Total Fare; however, not all of them are necessary.
In this analysis, it becomes sense to limit the airfare by taking into account only one course. This information was gathered over the period of a quarter of a year, from February to April, for what may be the busiest course in India. Every major point for each flight is physically gathered. Figure 1 represents the collected dataset of the different airlines.
Cleaning and Preparing Data
All the assembled data required an awesome bargain of work so after the amassing of data, it ought to have been idealized and be prepared as shown by the prerequisites. All the pointless data is erased like duplicates and invalid qualities. This is the most noteworthy and time-consuming part of this whole process. Diverse measurable strategies and rationales in python clean and set up data. For occasion, the taken a toll was character sort, not a number. Figure 2 depicts the clean and prepared dataset.
The dataset in figure 2 appears to be the data that is necessary for the investigation of information. Extra highlights are made to induce the most exact outcome. Incorporate columns like weekdays and sessions are produced to verify the information on the premise of the time length of the day and another component.
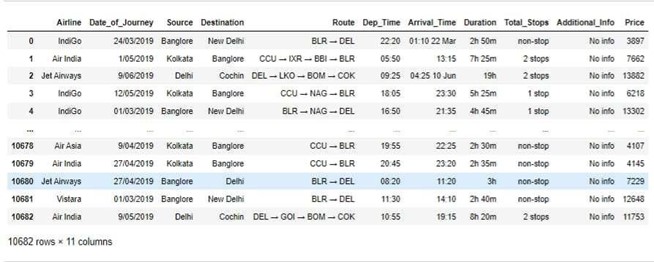
Figure 1. Collected Dataset
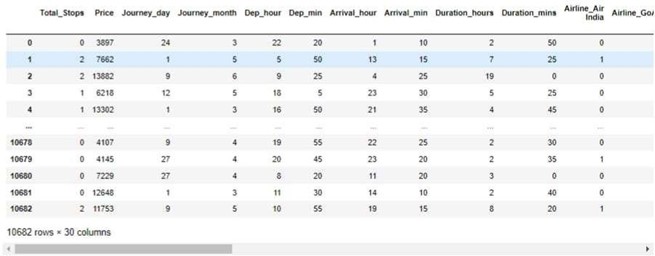
Figure 2. Clean and Prepared Dataset
Analyzing Data
Information tracking that involves dissecting the data, revealing the hidden patterns, and then quickly utilizing a variety of AI models. Moreover, a couple of highlights can be decided from today’s highlights. Days of flight can be issued by computing the distinction of the date and date on which data is collected. This may be watched for forty-five days. Also, the date of the flight is critical, whether it is on any random day, weekday, or end of the week. Impulses the flights arranged amid ends of week fetched more than weekdays. Furthermore, time also plays an important role and it is considered as Morning, Evening, and Night.
Machine Learning Model Performance
To foresee the airline ticket costs, numerous calculations are presented in the model using machine learning. The Calculations are Linear regression, Support Vector Machine(SVM), Decision Tree, K-nearest neighbors, Multilayer Perceptron, Gradient Boosting, and Random Forest Algorithm. Learn that these models were run using the scikit Python library. Parameters such as R-squared, MAE, and MSE are considered confirmations of these model runs.
Linear Regression
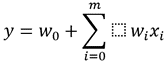
To decide the relationship between two persistent factors, a straightforward direct relapse investigation is utilized. One of two components is the pointer identifier of which regard is to be managed. It gives the truthful relation not the deterministic relation between two components. Direct relapse calculation gives the most excellent fit line to the information for which the expectation blunder is the least. Angle plummet and fetched work are the 2 major variables to get it straight relapse. The condition for the straight relapse.
![]()
The esteem of coefficients a1 and a0 was chosen so the blunder esteem is few as conceivable. The double anticipated and real esteem distinction provides the mistake. To deal with values less than zero, the mean square error is find out. Here a0 gives more than zero or less than zero coordination between X and Y while a1 is called bias. The precision of the relapse issue is found in terms of R-square, Mean Absolute Error, and Mean Square Error.
Decision Tree
This tree check divides the collected data into small subsets while making them relatively checkable. As with leaf centers, the tree with vote centers appears last. In any case, this selection center can contain two branches. First, think of almost the entire enlightenment file as root. The highlight homage is thrown in by chance. If there are any properties left at this point, they should be discretized recently when organizing the show. For inference, ownership records are modified recursively. Data acquisition and Gini recording are her two fundamental characteristics in choosing a tree computation. Information gain is defined as a change in the amount of entropy. Higher entropy indicates higher viability of the material. Entropy can therefore be a measure of subjective size vulnerability: Ginilists measure how regularly subjectively selected components are perceived as fraudulent. So you should enjoy features in lower Gini files. For regression trees, the obtained toll capacity can be a mandatory square condition:
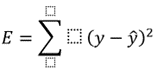
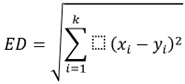
Where y is the actual rating from the data set and y cap is the predicted rating. To have the most anticipated course of assessment obtained through a sub-work called data collection. If the course were to be held partially unconditionally at the blade hub, the calculations would be huge, moderate, and overkill. To prevent this, a minimal number is distributed in the blade hub preparation box.
Support Vector Machine (SVM)
SVM is a supervised ML algorithm used for classification and regression studies. It usually works with small data sets and is very time consuming. Find a hyperplane divided into characteristic parts. There are ideal hyperplanes that classify various spaces. Information foci closest to the hyperplane are called back vector foci, deleted between the vector plane and these foci, these foci are Called edges.
The proposed work utilized SVM for regression analysis. Performance depends on the selection of kernel features as a non parametric method. Linear, radial basis functions, and polynomials are the core of support vector machine algorithms.
K-Nearest Neighbours (KNN)
In K-Nearest neighbor analysis, the result is the mean of k nearest neighbors. As a Support Vector Machine, it is also a nonparametric method. Considering few values come about are computed to attain the finest esteem. KNN may be an administered classification calculation that can too be utilized as a regressor. It relegates modern information to the course. Since it is non-parametric, it does not take any presumption. It calculates the separation between each prepared illustration and an unused information point. To compute this distance following distance calculation strategies are utilized:
Euclidean distance
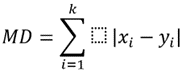
Manhatten Distance
K-entries are taken by the model which is closer to the new data point in the dataset.
Random Forest
This is an algorithmic design that collects less predictive results to provide a better predictive model. Combine the bases how in to one extended show. The highlights are tested and propagated up the tree without replacement to get the uncorrelated selection tree. A sub- relationship between trees is required to select the top part. A concept for generating random forests that differs from decision trees is aggregating uncorrelated trees.
Bagging Regression Tree
A disadvantage of decision trees is that simple trees have high variance and complex trees have high variance. Bagging comes from bootstrap aggregation, a strategy that uses permutation to select random information from a data set. It is generally used to suppress the shaking of trees. The letter states that gradient enhancement and random forest strategies are used to achieve the highest possible accuracy.
RESULTS
The yield of the model is plotted against the test data set for the selected test data set. The graph shows a comparative view of unique values and predicted values. By examining results from algorithms such as Support Vector Machine, decision trees, KNNs, bagging trees, random forests, and linear regression, we can obtain expected fare values for timely ticket purchases. Figure 1 shows the values of R square. The chart is plotted between days to takeoff and airfare. The blue line shows the actual value of the ticket and the red line shows the expected value of the ticket. Decision tree algorithms are more accurate than other algorithms for a given data set. Figure 3 shows a graph between the remaining flight days and the actual and predicted values evaluated by the random algorithm. It has the most notable R-squared estimator with the best precision within the regression analysis. R-squared, Mean-Squared Error, and Mean- Absolute Error values.
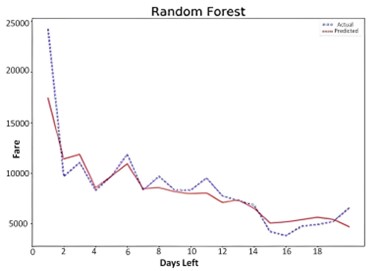
Figure 3. Random Forest
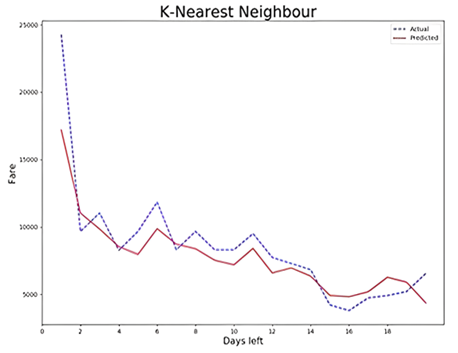
Figure 4. K- Nearest Neighbour
Figure 4 shows a graph between the number of days left to departure compared to the actual and predicted values evaluated by K-Nearest Neighbour. The R-Squared value approaches 1, giving the best accuracy. Predict flight prices considering all highlights such as time of day, day of the week, and day of the week the data set was released to flight. Of all these highlights, the number of days left before departure has the most significant impact on airfare forecasts.
CONCLUSIONS
We generate a dataset of courses from Bangalore to Chennai and use it as the deviation of cost fluctuation over a certain number of days period in order to assess the traditional technique. To anticipate dynamic fares, a machine learning algorithm is used to the dataset. This will at the very least allow you to estimate the cost of shipping your ticket. You can only get a limited amount of information, since the website selling the plane ticket is the one collecting the data. Demonstration accuracy is provided by the R-squared values that the method produces. If information such as current accessibility to a site is available in the future, then expected occurrences will be more accurate.
BIBLIOGRAPHIC REFERENCES
1. Stefanovič, P., Štrimaitis, R., & Kurasova, O. (2020). Prediction of flight time deviation for lithuanian airports using supervised machine learning model. Computational Intelligence and Neuroscience, 2020(1), 8878681.
2. Truong, D., & Choi, W. (2020). Using machine learning algorithms to predict the risk of small Unmanned Aircraft System violations in the National Airspace System. Journal of Air Transport Management, 86, 101822.
3. Gui, G., Liu, F., Sun, J., Yang, J., Zhou, Z., & Zhao, D. (2019). Flight delay prediction based on aviation big data and machine learning. IEEE Transactions on Vehicular Technology, 69(1), 140-150.
4. Kim, J., Justin, C., Mavris, D., & Briceno, S. (2022). Data-driven approach using machine learning for real-time flight path optimization. Journal of Aerospace Information Systems, 19(1), 3-21.
5. Esmaeilzadeh, E., & Mokhtarimousavi, S. (2020). Machine learning approach for flight departure delay prediction and analysis. Transportation Research Record, 2674(8), 145-159.
6. Wang, Z., Liang, M., & Delahaye, D. (2018). A hybrid machine learning model for short-term estimated time of arrival prediction in terminal manoeuvring area. Transportation Research Part C: Emerging Technologies, 95, 280-294.
7. Gupta, A., Jain, A., Varshney, A., Parmar, A., Sirohi, A., & Saini, A. K. (2023). Flight Fare Prediction Using Machine Learning Algorithm. Journal of Data Acquisition and Processing, 38(2), 2822.
8. Tziridis, K., Kalampokas, T., Papakostas, G. A., & Diamantaras, K. I. (2017, August). Airfare prices prediction using machine learning techniques. In 2017 25th European Signal Processing Conference (EUSIPCO) (pp. 1036-1039). IEEE.
9. Tanouz, D., Subramanian, R. R., Eswar, D., Reddy, G. P., Kumar, A. R., & Praneeth, C. V. (2021, May). Credit card fraud detection using machine learning. In 2021 5th International Conference on Intelligent Computing and Control Systems (ICICCS) (pp. 967-972). IEEE.
10. Rajankar, S., Sakhrakar, N., & Rajankar, O. (2022). Flight fare prediction using machine learning algorithms. Int. J. Eng. Res. Technol.(IJERT), 10(5).
11. Groves, W., & Gini, M. (2013, May). An agent for optimizing airline ticket purchasing. In Proceedings of the 2013 international conference on Autonomous agents and multi-agent systems (pp. 1341-1342). https://towardsdatascience.com/machine-learning-basics-decisiontree-regression-1d73ea003fdaarticleondecisiontreeregression.
12. Bhatia, S., Goel, A. K., Naib, B. B., Singh, K., Yadav, M., & Saini, A. (2023, July). Diabetes Prediction using Machine Learning. In 2023 World Conference on Communication & Computing (WCONF) (pp. 1-6). IEEE. doi: 10.1109/WCONF58270.2023.10235187
13. Singh, K., Singh, Y., Barak, D., Yadav, M., & Özen, E. (2023). Parametric evaluation techniques for reliability of Internet of Things (IoT). International Journal of Computational Methods and Experimental Measurements, 11(2). http://doi.org/10.18280/ijcmem.110207
14. Singh, K., Singh, Y., Barak, D., & Yadav, M. (2023). Evaluation of Designing Techniques for Reliability of Internet of Things (IoT). International Journal of Engineering Trends and Technology, 71(8), 102-118. https://doi.org/10.14445/22315381/IJETT-V71I8P209
15. Singh, K., Singh, Y., Barak, D. and Yadav, M., 2023. Comparative Performance Analysis and Evaluation of Novel Techniques in Reliability for Internet of Things with RSM. International Journal of Intelligent Systems and Applications in Engineering, 11(9s), pp.330-341. https://www.ijisae.org/index.php/IJISAE/article/view/3123
16. Singh, K., Yadav, M., Singh, Y., & Barak, D. (2023). Reliability Techniques in IoT Environments for the Healthcare Industry. In AI and IoT-Based Technologies for Precision Medicine (pp. 394-412). IGI Global. DOI: 10.4018/979-8-3693-0876-9.ch023
17. Singh, K., Singh, Y., Barak, D., & Yadav, M. (2023). Detection of Lung Cancers From CT Images Using a Deep CNN Architecture in Layers Through ML. In AI and IoT-Based Technologies for Precision Medicine (pp. 97-107). IGI Global. DOI: 10.4018/979-8-3693-0876-9.ch006
18. Kumar, S., Kumar, A. , Parashar, N., Moolchandani, J., Saini, A., Kumar, R., Yadav, M. , Singh, K., & Mena, Y. (2024). An Optimal Filter Selection on Grey Scale Image for De-Noising by using Fuzzy Technique. International Journal of Intelligent Systems and Applications in Engineering, 12(20s), 322–330. Retrieved from https://ijisae.org/index.php/IJISAE/article/view/5143
19. Singh, K., Singh, Y., Khang, A., Barak, D., & Yadav, M. (2024).Internet of Things (IoT)-Based Technologies for Reliability Evaluation with Artificial Intelligence (AI). AI and IoT Technology and Applications for Smart Healthcare Systems, 387. http://dx.doi.org/10.1201/9781032686745-23
20. Bhatia, S., Goel, N., Ahlawat, V., Naib, B. B., & Singh, K. (2023). A Comprehensive Review of IoT Reliability and Its Measures: Perspective Analysis. Handbook of Research on Machine Learning-Enabled IoT for Smart Applications Across Industries, 365-384. DOI: 10.4018/978-1-6684-8785-3.ch019
21. Singh, K., Mistrean, L., Singh, Y., Barak, D., & Parashar, A. (2023). Fraud detection in financial transactions using IOT and big data analytics. In Competitivitatea şi inovarea în economia cunoaşterii (pp. 490-494). https://doi.org/10.53486/cike2023.52
22. Sood, K., Dev, M., Singh, K., Singh, Y., & Barak, D. (2022). Identification of Asymmetric DDoS Attacks at Layer 7 with Idle Hyperlink. ECS Transactions, 107(1), 2171. http://dx.doi.org/10.1149/10701.2171ecst
23. Singh, K., Yadav, M., Singh, Y., Barak, D., Saini, A., & Moreira, F. Reliability on the Internet of Things with Designing Approach for Exploratory Analysis. Frontiers in Computer Science, 6, 1382347. doi: 10.3389/fcomp.2024.1382347
24. Singh, K., Yadav, M., Singh, Y., & Barak, D. (2024). Finding Security Gaps and Vulnerabilities in IoT Devices. In Revolutionizing Automated Waste Treatment Systems: IoT and Bioelectronics (pp. 379-395). IGI Global. DOI: 10.4018/979-8-3693-6016-3.ch023
25. Hajimahmud, V. A., Singh, Y., & Yadav, M. (2024). Using a Smart Trash Can Sensor for Trash Disposal. In Revolutionizing Automated Waste Treatment Systems: IoT and Bioelectronics (pp. 311-319). IGI Global. DOI: 10.4018/979-8-3693-6016-3.ch020
26. Yadav, M., Hajimahmud, V. A., Singh, K., & Singh, Y. (2024). Convert Waste Into Energy Using a Low Capacity Igniter. In Revolutionizing Automated Waste Treatment Systems: IoT and Bioelectronics (pp. 301-310). IGI Global. DOI: 10.4018/979-8-3693-6016-3.ch019
27. Singh, K., Yadav, M., & Yadav, R. K. (2024). IoT-Based Automated Dust Bins and Improved Waste Optimization Techniques for Smart City. In Revolutionizing Automated Waste Treatment Systems: IoT and Bioelectronics (pp. 167-194). IGI Global. DOI: 10.4018/979-8-3693-6016-3.ch012
28. Khang, A., Singh, K., Yadav, M., & Yadav, R. K. (2024). Minimizing the Waste Management Effort by Using Machine Learning Applications. In Revolutionizing Automated Waste Treatment Systems: IoT and Bioelectronics (pp. 42-59). IGI Global. DOI: 10.4018/979-8-3693-6016-3.ch004
29. Sharma, H., Singh, K., Ahmed, E., Patni, J., Singh, Y., & Ahlawat, P. (2021). IoT based automatic electric appliances controlling device based on visitor counter. DOI: https://doi. org/10.13140/RG, 2(30825.83043).
30. Singh, K., & Barak, D. (2024). Healthcare Performance in Predicting Type 2 Diabetes Using Machine Learning Algorithms. In Driving Smart Medical Diagnosis Through AI-Powered Technologies and Applications (pp. 130-141). IGI Global. DOI: 10.4018/979-8-3693-3679-3.ch008
31. Groves, W., & Gini, M. (2015). On optimizing airline ticket purchase timing. ACM Transactions on Intelligent Systems and Technology (TIST), 7(1), 1-28.
32. Wohlfarth, T., Clémençon, S., Roueff, F., & Casellato, X. (2011, December). A data-mining approach to travel price forecasting. In 2011 10th International Conference on Machine Learning and Applications and Workshops (Vol. 1, pp. 84-89). IEEE.
33. Domínguez-Menchero, J. S., & González-Rodríguez, G. (2007). Analyzing an extension of the isotonic regression problem. Metrika, 66(1), 19-30.
34. Wang, Z., Liang, M., & Delahaye, D. (2018). A hybrid machine learning model for short-term estimated time of arrival prediction in terminal manoeuvring area. Transportation Research Part C: Emerging Technologies, 95, 280-294
35. Yazdi, M. F., Kamel, S. R., Chabok, S. J. M., & Kheirabadi, M. (2020). Flight delay prediction based on deep learning and Levenberg-Marquart algorithm. Journal of Big Data, 7(1), 106.
36. Khaksar, H., & Sheikholeslami, A. (2019). Airline delay prediction by machine learning algorithms. Scientia Iranica, 26(5), 2689-2702.
FINANCING
The authors did not receive financing for the development of this research.
CONFLICT OF INTEREST
The authors declare that there is no conflict of interest.
AUTHORSHIP CONTRIBUTION
Conceptualization: Khushwant Singh, Mohit Yadav, Vugar Hacimahmud Abdullayev.
Investigation: Khushwant Singh, Mohit Yadav, Vugar Hacimahmud Abdullayev.
Methodology: Khushwant Singh, Mohit Yadav, Vugar Hacimahmud Abdullayev.
Drafting - original draft: Khushwant Singh, Mohit Yadav, Vugar Hacimahmud Abdullayev.
Writing - proofreading and editing: Khushwant Singh, Mohit Yadav, Vugar Hacimahmud Abdullayev.